Summary
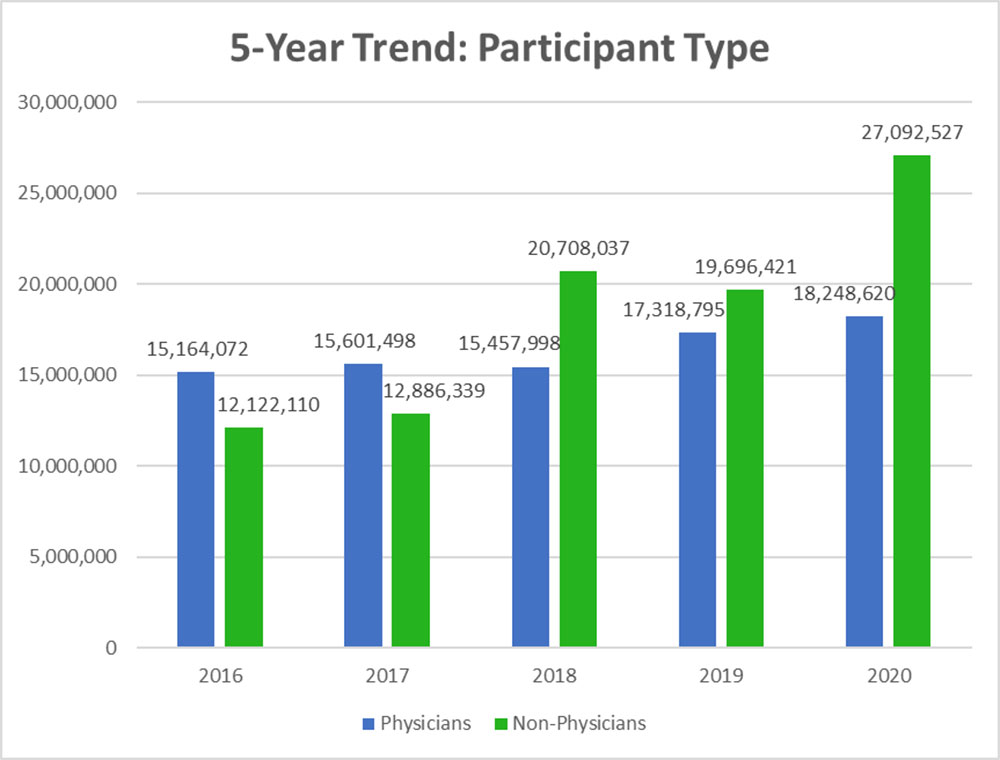
The ACCME’s 2020 Annual Report data was released on June 15, 2021. The report highlights continued growth in several key areas and notes that the anticipated decline in other areas was primarily related to the COVID-19 pandemic. The report analyzed data from 1,680 accredited CE providers who offered, collectively, nearly 172,000 activities. Analysis shows a noteworthy increase in participants attending CE activities amidst the pandemic. For the third straight year, non-physician participants (60%) attending CE activities surpassed physician participants (40%) and non-physician participant interactions increased by 37.55% from 2019 to 2020. The number of physician learners increased by 5.37% in 2020, approximately one million more physician interactions than in 2019. While the overall number of accredited CE activities decreased by 9.04%, learner participation increased by 22.49% or approximately 8 million learners. Three-year trend data illustrates that the number of physician participants has increased by 18.05% while the number of non-physician participants at accredited CE activities has increased by 30.83% since 2018. Overall participation in accredited CE activities has increased each year since 2010. Effectively, the CE enterprise continues to evolve and make available high-quality, CE activities that promote interprofessional learning and improvements across clinician competence, performance, and patient outcomes.
In light of the COVID-19 pandemic, the ACCME report also highlights key data related to COVID-19 accredited CE activities. Across ACCME-accredited providers, 46.79% (786) planned and implemented COVID-19 related CE activities for a total of 6,417 activities offered in 2020. Of these activities, 38% were offered as internet live activities, while 35% were internet enduring material activities and 17% were courses. What is highlighted by these statistics is the response of accredited providers to design and disseminate critical information to members of the healthcare team during this unprecedented pandemic.
2020 Stats
- Accredited educational activities decreased by 9.04% in 2020, while overall learner interaction increased by 22.49%.
- Total physician participation at CE activities increased along with non-physician participation. Non-physician participation increased by approximately 38% from 2019. Physician participation saw a 5% increase as compared to 2019.
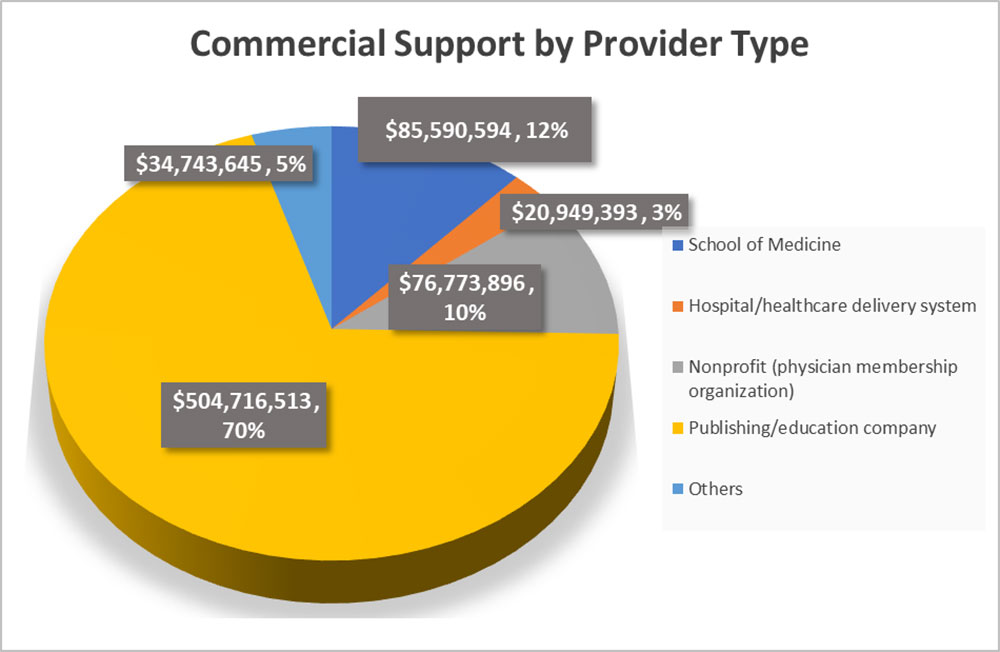
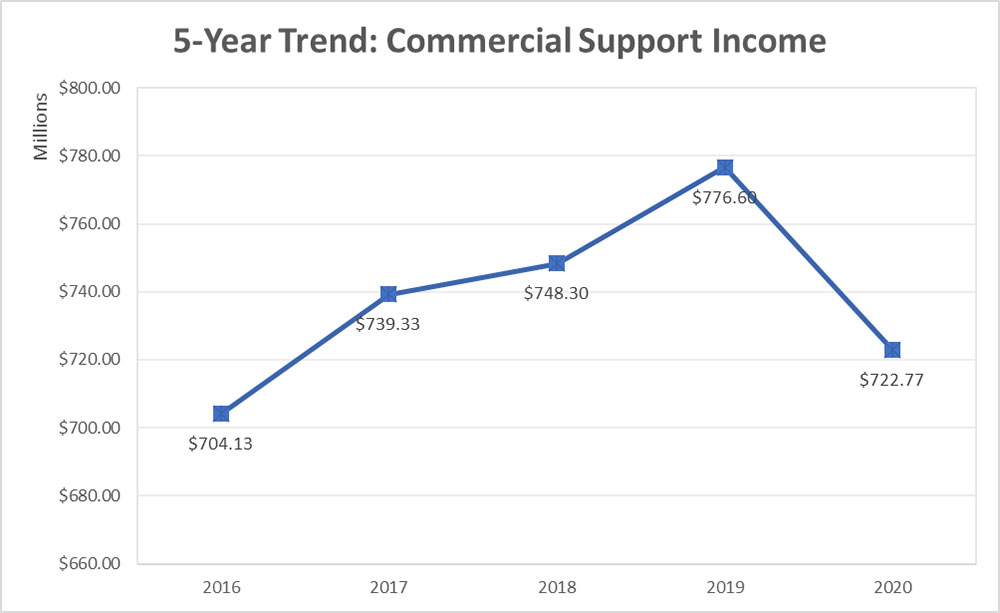
- Total commercial support contributions decreased by 6.93%, an estimated $54 million.
- Income from advertising/exhibits decreased significantly from $542 million in 2019 to $220 million in 2020, a direct result of the pandemic and the halt put on in-person activities.
- Total annual income for CE decreased by $815 million, a 26.64% decrease from 2019.
- Of total attendance at CE activities, 40% of attendees were physicians and 60% were non-physicians.
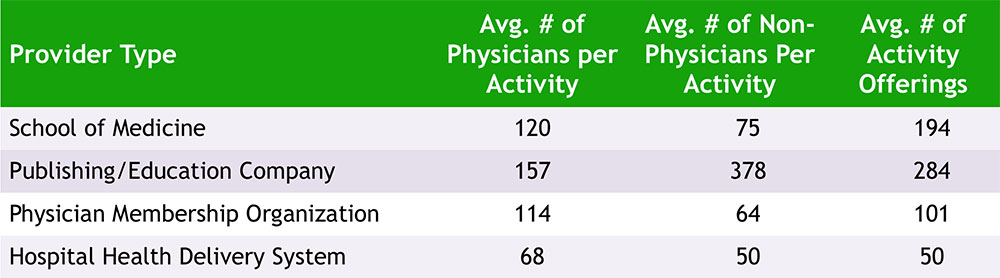
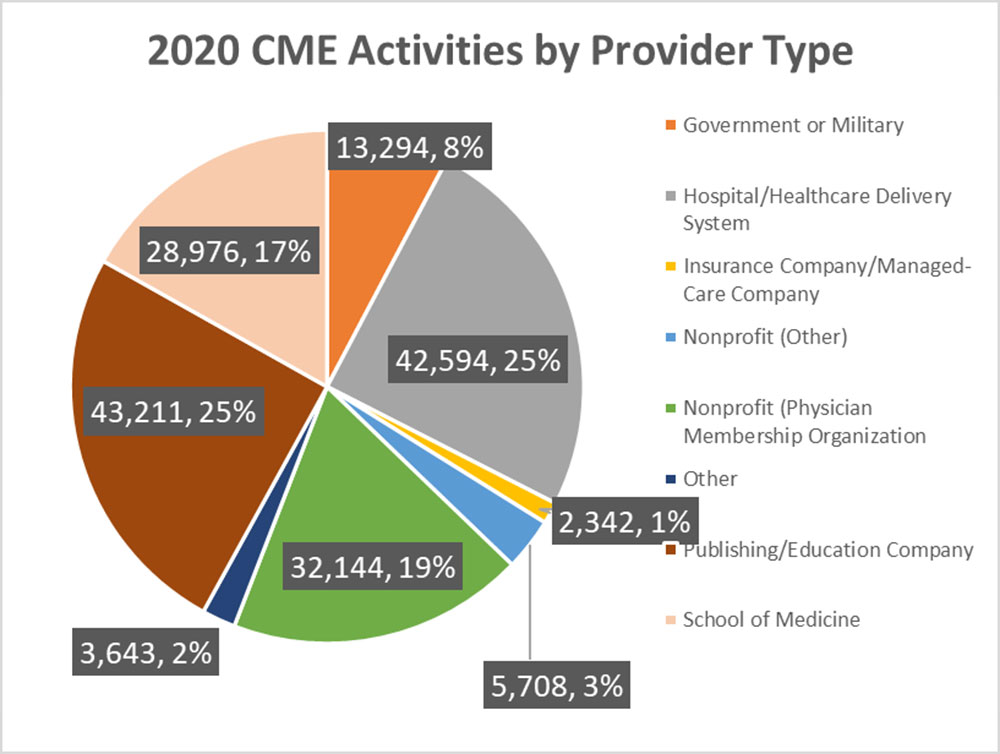
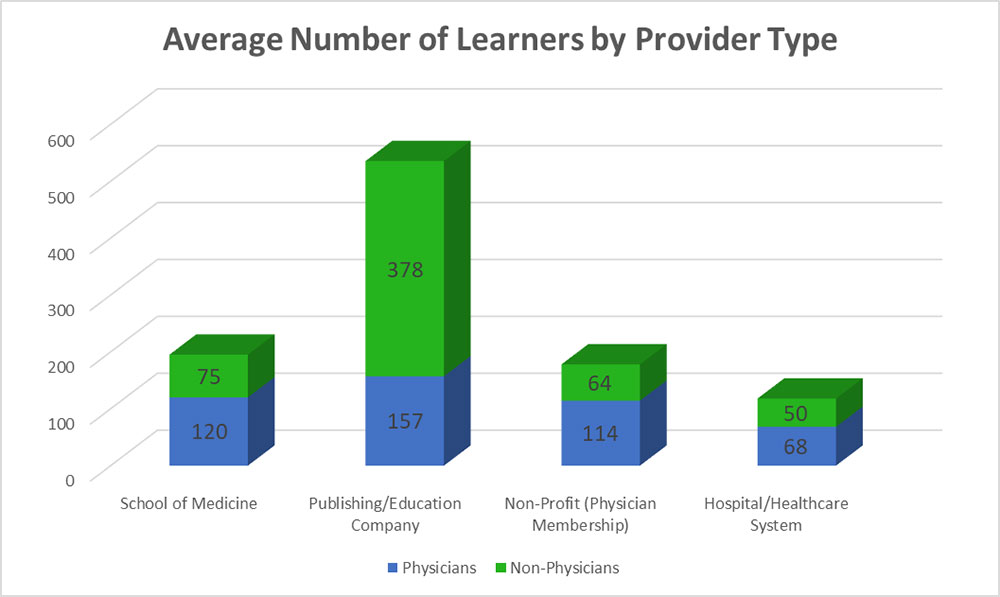
Provider Type Comparison Data
For a full copy of the ACCME 2020 Annual Report, visit: https://accme.org/2020datareport.