Summary
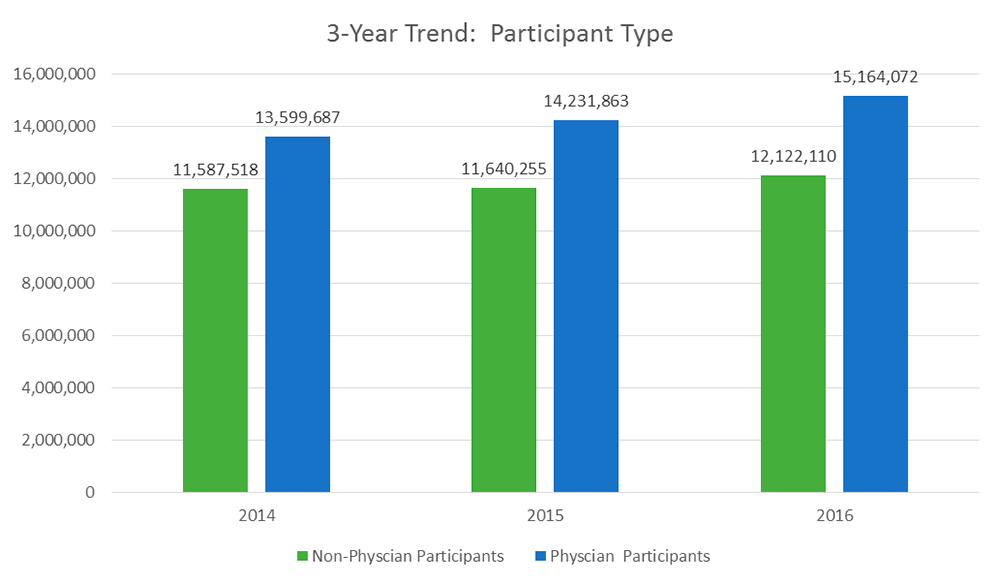
The ACCME Data Report for 2016 was released July 13, 2017, including annual growth highlights and key takeaways within the accreditation system. The report details information from more than 1,800 accredited CME providers who offered close to 159,000 educational activities. Analysis shows an increase of physician participants and non-physician participants at these activities. The number of educational activities and participants have risen each year since 2010. This growth illustrates the increased engagement of learners in quality CME activities that promote interprofessional collaborations and evolution of healthcare, in order to improve physician performance and ultimately patient outcomes. AOE’s three-year trend data summarized below shows the number of physician participants has increased by 11.5% while the number of non-physician participants has increased by 5% since 2014. This is the second year of modified annual reporting, which included elimination of CME program expenses reporting of income under specific categories. This enables a more aligned comparison of ‘income data’ from 2015 to 2016.
AOE Analysis: 2016 Stats
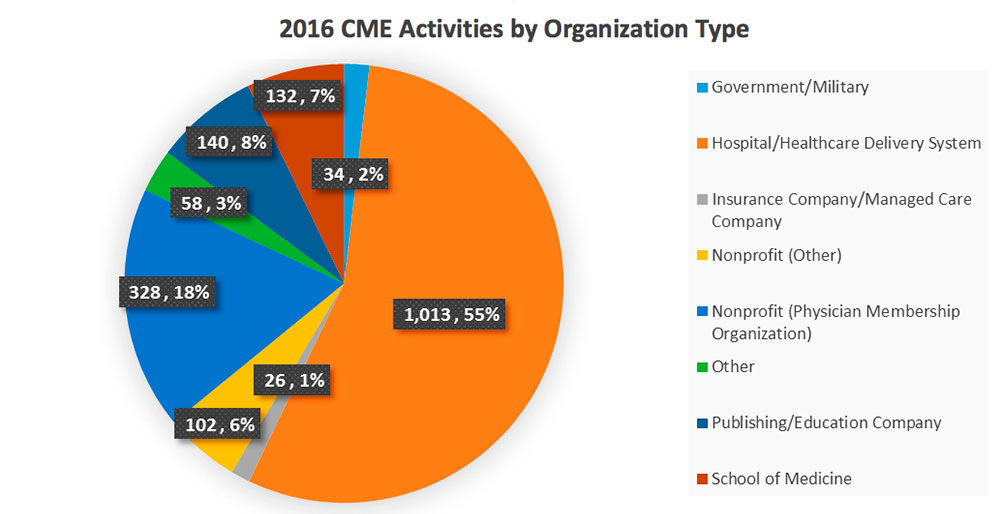
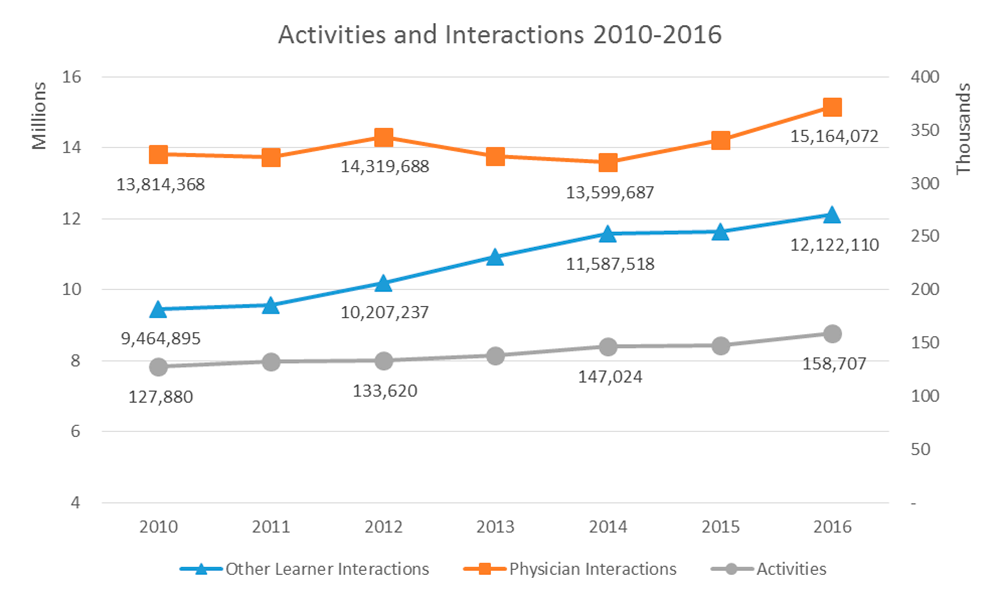
- Total number of accredited educational events grew by 7%. The number of activities have increased each year since 2010.
- Total physician and non-physician participation at CME activities increased; physician participation increased by nearly 7%, a 2% increase from 2015. Non-physician participation showed nice growth with a 4% increase, more than a 3.5% increase from 2015.
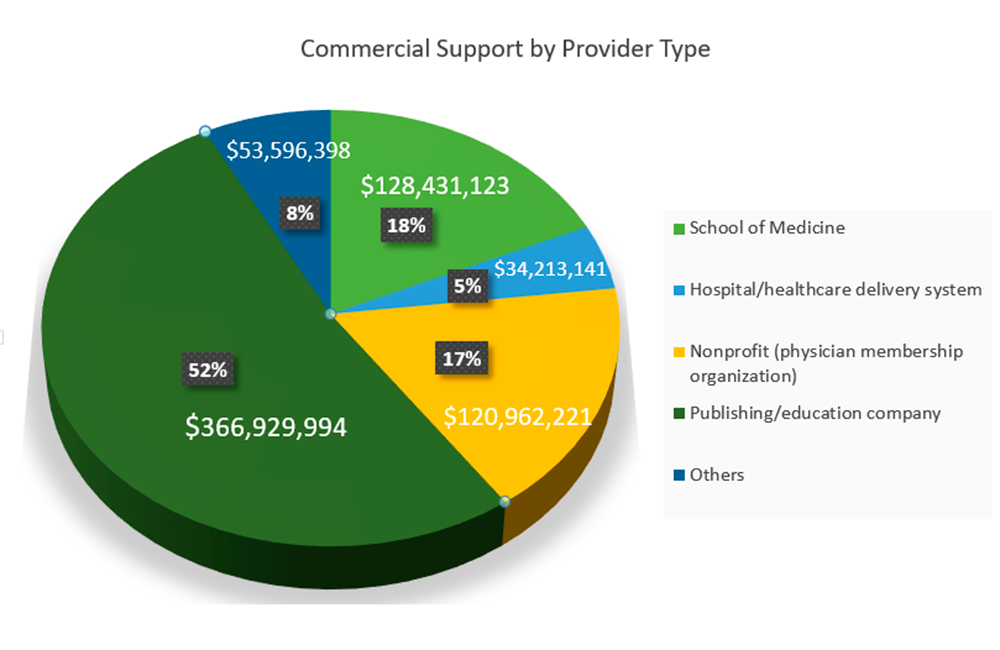
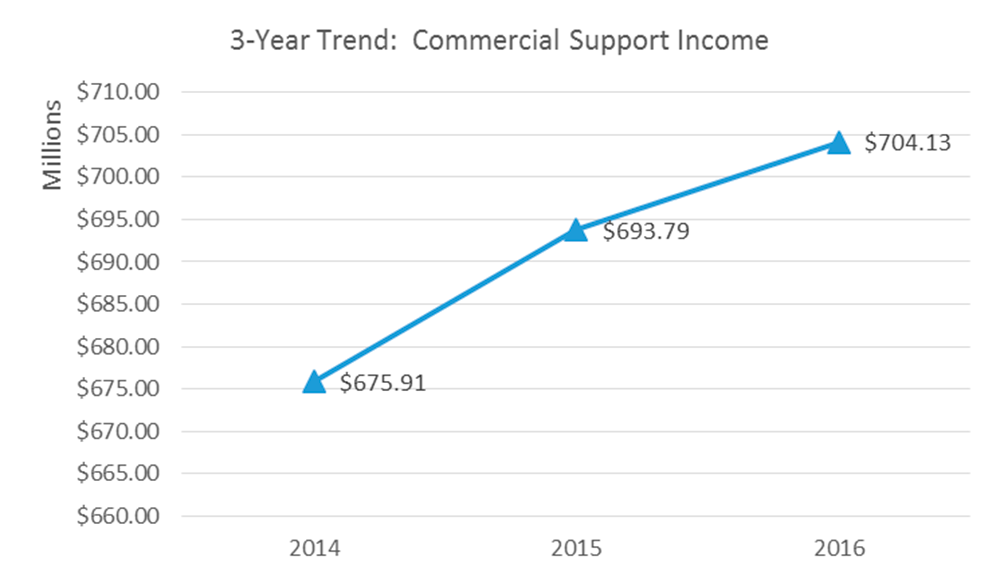
- Total commercial support contributions rose only slightly, 1.5%, by an estimated $10 million. (Note: This halted a steady 2-year tread in which contributions had risen by 2.4% in 2014 and 2.6% in 2015).
- Income from advertising/exhibits increased from $390 million in 2015 to $411 million in 2016, a 5.5% increase.
- Total annual income for CME increased by almost $52 million, a 2% increase.
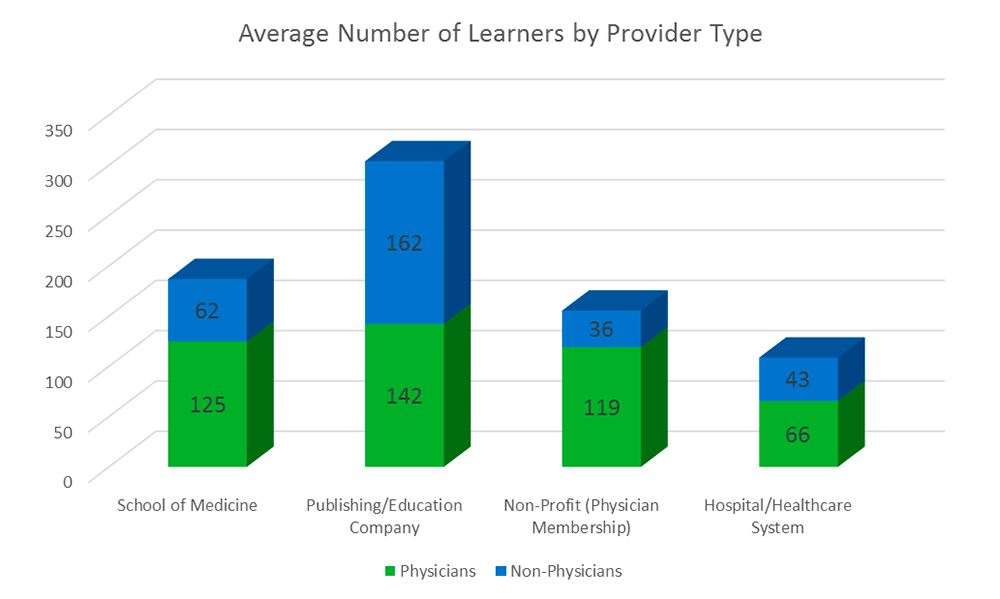
- Of total attendance at CME activities, 56% of attendees were physicians and 44% were non-physicians.
Provider-Type Comparison Data
Multi-Year Trend Data
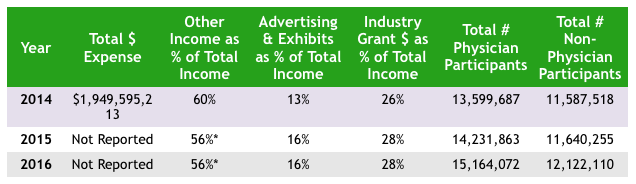
*Starting in 2015, “Other Income” was eliminated, and replaced with:
- 2015: Registration Fees – 53%; Government Funding – 1%; Private Donations – 2%
- 2016: Registration Fees – 54%; Government Funding – 1%; Private Donations – 1%
For a full copy of the ACCME 2016 Annual Report, visit: http://www.accme.org/news-publications/publications/annual-report-data/accme-2016-data-report